The Importance Scale Myth
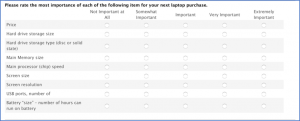
Recently, I heard a colleague present the results of a research survey. One area of the survey addressed the importance of various factors in determining marketplace actions. At this juncture he said,
“Everything looks important.”
It was apparently true. For each of the three factors questioned, over 50% of the respondents used the top box score of 5 (on a 1 to 5 scale), indicating Extremely Important. More than 80% of the respondents gave a 4 or 5 rating.
 So what did we learn from this? Not much about the criticality of different factors, but we can learn an important lesson about survey instrument design practices.
Most any customer research is likely to touch on the topic of measuring the importance or value of some set of factors. Perhaps the focus is the importance of aspects of services or products to the overall business relationship. Perhaps it’s the importance of alternative future actions the company could take. Our real interest lies in the importance of each factor relative to the other factors.
This is fundamental Pareto Analysis: separate the critical few from the trivial many. If everything is important, then where do you focus your energies?
The challenge lies in how the question is asked. Most survey designers will follow the practice shown above — asking respondents to evaluate each factor individually on an interval rating scale. Few factors will get low- or mid-level ratings.
For example, what if you were surveyed about the importance of various aspects of a recent flight you took. What would not get a very high rating?
- Flight schedules?
- Price?
- Security processes?
- Speed of check-in?
- Handling of checked baggage?
- Seat comfort?
- On-time arrival?
- Flight attendant actions?
- Meal quality? (Well, okay… airlines seldom serve meals…)
Perhaps the movie selection would get low importance scores. Yet, one or two of those items is likely far more important to you. But it’s hidden because you were not forced to perform an explicit trade-off analysis.
So what’s the solution? Six research approaches can be used to garner importance from respondents. Here’s a quick review of each approach.
Interval Rating Scales
This is the more typical approach just described. Respondents are presented with a rating scale and asked to rate the importance of items. (An interval rating scale requires a consistent unit of measurement. The cognitive distance between adjacent pairs of points must be equal intervals. The distance from a 1 to a 2 must be the same as 2 to a 3 and so on.) Other questions on the survey likely will use an interval scale, so it’s natural to apply the scale to importance questions as well.
We’ve seen what this leads to: a lack of actionable data. Everything is important — so nothing is important.
Forced Ranking Scales
An alternative is to ask the respondent to rank order a set of items. For example, six factors might be presented and the respondent is asked to place a “1” next to the most important factor, a “2” next to the second most important factor, and so on.
Sounds great. We force the respondent to think of the factors as a set and rank them. But there are serious shortcomings to this approach.
- Can’t calculate averages. We’d be tempted to take an average of the ranking scores respondents assigned to each factor. However, the question did not generate interval data; it generated ordinal data.That is, the items are in rank order but even spacing does not exist between each pair of ranked items. For example, some respondents may consider the items ranked 1 and 2 as almost equal, but the item ranked 3 is a distant third.You can take an average, but it would be statistically improper and could be misleading. Your analysis is really limited to cumulative frequency distributions for each factor. For example, “60% of respondents ranked Item A as first or second in importance.”
- Respondent Annoyance. On a web-form survey, you could provide error feedback and not let the respondent move through the survey without completing the question correctly. You’ll see various designs for forced rank questions, and all are likely to annoy some respondents as they complete the question. Many respondents will just quit the survey.
- Respondent Error. You could also “correct” the errors — that’s all you can do on a hardcopy survey. But what are the correct answers? You will be introducing error into the survey data because they’ve become your responses, not the respondents’.
- Respondent Burden. You can only ask the respondent to rank order a limited set of items. Ranking even six items is asking a lot of the respondent.
Multiple-Response, Multiple-Choice Questions
One viable solution is to seemingly step back in the sophistication of the question design by using a multiple-response, multiple-choice question format. Ask the respondent to select from a list of items the 2 (or maybe 3) most important items to them. Your analysis will then be the percent of respondents who selected each item in their top 2. The respondent burden — the amount of work you’re asking the respondent to do — is much less, and the results are still meaningful. Many of the web survey tools will allow you to limit — or force — the number of items checked to a specific number.
The number of items you should ask people to check is driven in good part by the number of items from which they have to choose. Two or three is a reasonable number of items, but if you have one item that you know everyone is likely to select, then you might want to ask for an additional choice.
For example, price would likely be a top-three choice for everyone regarding factors that affect a purchase decision. True, you could not ask price, but people would write it in or think you don’t know what you’re doing.
To enhance your data, you can also pose a follow-up question asking the respondent which of the three choices they just checked would be their number one choice. Then, you could pose a second follow-up question about the remaining two choices. Some web-form survey software will perform a threaded branch in which the selections from the first question are carried forward to the subsequent questions. In essence, you’re asking respondents to rank order their top three choices — without presenting a set of instructions that would likely confuse many people.
Fixed-Sum Questions
A question format that combines the interval scale with the forced ranking is the fixed-sum or fixed-allocation question format. Here, you present the respondent with the same set of items and ask them to allocate 100 points across the items based on their relative importance.
The respondent has to make a trade-off. More points for one selection means fewer points for another. The depth of thinking required means this question format is high in respondent burden, but there’s real value in that thinking.
A key decision is how many items to present. Four, five or ten are optimal since they divide evenly into 100. Some web survey tools allow you to set the total to something other than 100. For example, if you decide on 7 items, then have the items total to 70. The tools should provide a running total to the respondent and can force the question to be completed correctly. Otherwise some data cleansing will be necessary, but that is likely worth the effort for the very rich data the format can generate.
Correlation and Regression Analysis
One way to measure importance is to not ask it at all! Instead, importance can be derived statistically from the data set. Consider the scenario where you have questions measuring the satisfaction with various aspects of a product or service and you want to know how important each is to overall satisfaction. Include a summary question measuring overall satisfaction, which you probably would anyway, and skip any questions about importance. Using correlation or regression analysis, you can determine which items align most closely to overall satisfaction. But be sure your manager can understand and will accept the findings.
Conjoint analysis
A final method involves a more complex statistical technique, conjoint analysis. This technique is particularly useful in constructing product offerings where various features are combined into bundles, and the researcher wants to know how important each factor is in driving purchase decisions.
Conjoint analysis requires a special research survey where the respondent is presented with pairs of factors asking the relative importance of one over the other. Subsequently, the respondent is presented with two versions of the product, each with different sets of features based upon the previous responses and asked which product version they prefer. The findings show the relative importance of each feature, and the tool allows posing many “what if” scenarios.
For another “take” on this important topic read about the different ways to skin the importance cat.
In conclusion, measuring importance doesn’t have to lead to frustration with useless data. Think about these alternatives when constructing the research program and the survey instrument, and you can generate useful, meaningful data for business decisions. My fall back is the multiple-choice checklist approach. Simple for the respondent, yet it provides meaningful information for management.